2.3. Consumption and customers
On average, in the last decade, demand for power has grown on average to 2.7% yearly in SEN. Figure 6 shows the evolution of the maximum demand of electric power in the country in the period 2007-2020 in the SIC and SING. The continuous growth of energy and power demand allows us to assume large investment requirements for the following decades, not only because of the economic growth of the country, but also because of the growing intensive use of electrical appliances in homes, shops and industries and the imminent penetration of electric transport in the main cities of the country.
Figure 6: Maximum historical power demand
Source: Own elaboration from of the history of maximum demands. National Electrical Coordinator.
The General Law on ElectricAL Services in Chile (DFL N°4 of 1982) divides electricity consumption into two main segments: regulated customers and free customers:
The regulated customer segment is made up of consumers with a connected power of 5 MW or less, with the possibility of power between 500 kW and 5 MW, which are located in the concession area of a distribution company, to be chosen free customers. For 2020, regulated consumers account for 38,7% of the total consumption in the SEN [5]. The payment of fee is described in the section 4.
In this market, the sales of the generating companies are directed to the distribution companies, which acquire the energy through a process of regulated tenders, whose resulting prices are denominated “long-term node prices”, as the biddings adjudge blocks of energy for lengthy terms (15 and 20 years in the last tenders). These tenders were introduced via legal changes in 2005 (Law 20018 of 2005), to start in 2010 with the supply. However, after a series of tenders resulted in high award prices and the total supply of demand was not achieved, it was decided to perfect this system. The bidding system was improved by the CNE by modifying bidding rules in 2014, allowing for the first time to make supply offers for a limited number of hours of the day (previously the energy blocks tendered had to compromise supply by the 24 hours of the day). This allowed the NCRE to vary and with certain periodic patterns of resource and production, to compete in the schedules that more produce, expanding the supply and pushing the prices down, becoming a competitive and economic alternative of supply. Subsequently, new perfections were made in 2015 [6] to increase competition. Some of the most important modifications were the following:
- A more flexible scheme is established to define supply blocks that allows for long-term (5 years ahead) and short-term tenders that allow adjustment to more immediate needs.
- It incorporates clauses that allow new projects to cancel or delay their sale of energy in the event that their initiatives are delayed due to facts that can not be attributed to the offeror.
- It is given a role of greater importance to the CNE, being responsible for elaborating the bidding rules, realizing the demand projections and thus also having the responsibility, control and conduct of the process.
Figure 7 presents a summary of the results of the regulated bidding processes and clearly shows the consistent decline in the average award price until 2017 due to the greater competition achieved. It is worth mentioning that in the years 2017 and 2020 no public bids for electricity supply were held due to a lower estimate of the demand of the system, therefore there are no requirements for new energy contracted. However, in 2021 there were tenders that will be published in the next update of this book.
Figure 7: Average prices and volumes of energy contracted in regulated tenders
Source: Own elaboration from Statistical Yearbook of Energy. CNE.
Before these tenders for regulated customers were established, the contracts between generation and distribution companies were made at “short-term node price”, which corresponds to a price calculated twice a year (in April and October) by CNE and represented an average projection of marginal costs for the next 48 months adjusted for market prices of free customer contracts. In the period in which both types of supply contracts coexist (the former at the short-term node price and the most recent at the long-term node price), the price for energy and power that distribution companies must transfer to its regulated customers corresponds to the “average node price [7]” which is equal to the weighted average of long-term node prices and short-term node prices. It should be noted that the average node price is calculated for each distribution company initially separately and then an adjustment procedure is applied to a band, so that the energy price of any distribution company exceeds the average price by more than 5% of the entire system.
At these energy and power prices, from the generation-transport sector, a component associated with the cost of distribution must be added, and then from these costs to form the regulated customer tariff. Thus, at the energy and power prices, the so-called VAD (Added Value of Distribution) is added, calculated in tariff processes based on average distribution costs that are carried out every 4 years.
In these processes, models based on the concept of model companies (efficient theoretical companies) are estimated to cover efficient distribution costs, including costs of operation, maintenance, operation and losses, as well as to provide a return of investments. It is worth mentioning that, in December 2019 (Law N°21,194), the profitability rate was modified from 10% before taxes to a range between 6% and 8% after taxes. . The model companies are generated from a sample of real reference companies, representative of the different realities of density and consumption, from the most rural to urban.
Based on the above, the CNE proceeds to set maximum prices at the end user level (except free customers), considering three basic elements:
- A fixed charge per connection, regardless of size and usage.
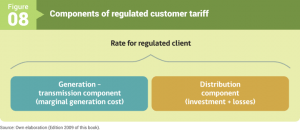
- A variable charge for energy consumed, which integrates the components of generation-transmission costs (reflects the marginal cost of supply at the withdrawal point) and distribution (investment plus distribution losses component).
- A charge for power or variable charge for energy consumed at peak times, depending on the rate option[8].
The most important charges are the last two, which reflect the energy consumption and customer power demand, while the fixed charge is a minor component. Structured regulated tariffs are based on these elements, which depend on the level of voltage and size of customers. Figure 8 shows the general structure of the regulated tariff that adds the two components described above.

The Electric Portability Law is currently in the first process, it separates the energy marketing service from the distribution service, the former being competitive and the latter a natural monopoly that is maintained with price regulation. Therefore, the project seeks to establish the right to electric portability, that is, to enable all end users to choose their electricity supplier, so that they can obtain prices lower prices, along with differentiated and personalized offers, as well as a better quality of commercial service. In addition, a body called Information Manager is created, of a private and tendered nature, whose purpose will be to guarantee total independence in the handling of information, the protection of customer data and controlled and symmetrical access for the different interested parties. Also, the project establishes a mechanism for gradual implementation of the provisions of this law, where the first communes will be determined where portability will come into force, the possibility of carrying out pilot projects, and the gradualness with which the other communes will enter the regime. proposed.
Law 20.928 was enacted in 2016, which “establishes mechanisms of equity in electricity tariffs” in systems greater than 200 MW of installed capacity, that is to say, in SEN. One of the amendments incorporated in this Law is that it equalizes residential rates among different distribution companies, through the Tariff Equity mechanism, preventing a residential customer from facing differences greater than 10% of the national average account. In low-density rural areas, the distribution cost component was sometimes very high, as it was distributed among few customers, resulting in very high rates. This law limits these high rates and are financed by all customers subject to price regulation, and in the case of residential customers, those that are below the national average and with a consumption that does not exceed 200 kWh/month are excluded.
In addition, other amendments incorporated by this new law are discounted to the price of electricity in municipalities that are intensive in electricity generation through the Local Generation Recognitionmechanism (RGL). The discount applied on the energy price distributed by the distribution companies to their customers is determined by a factor of intensity calculated as the installed power divided by the number of regulated customers that have the commune. The applicable discount ranges from 4.38% to 50% for communes with intensities from 2.5 kW to 2000 kW per regulated customer, as shown in Table 2.

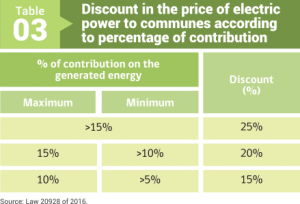
Likewise, in those communes in which power plants are located whose generation of energy, as a whole, is greater than 5% of the total generation of the power plants of SEN, an additional discount is applied, ranging from 15% to 25%, according to Table 3.

It is worth mentioning that in October 2019 Law 21.185 was enacted, which created a temporary mechanism to stabilize electricity prices for regulated customers, setting a Stabilized Price to Regulated Customer (PEC) until December 2027, taking the fixed prices as a basis. by Decree 20T/2019. In this way, during the validity of the mechanism, the discounts for the RGL mechanism will not be recalculated.
Finally, it should be noted that Law 20571 of 2012 or Net Billing Law, , modified in 2018 with Law 21.118, enabled regulated customers to inject their surplus energy into the grid through renewable generation equipment or efficient cogeneration, valuing their energy at the avoided cost of energy, that is to say, the same price at which distribution companies buy it from large generation companies plus the average losses that are avoided. More details on this law are presented in section 3.6.
The term free customer is designated in Chile to final customers with high power installations, consuming above a minimum threshold. These large customers freely agree prices and conditions with their suppliers.
This segment is made up of all consumers whose connected power exceeds 5 MW. In addition, optionally customers whose connected power is greater than 500 kW can choose to be a free customer. Usually the free customer is of industrial or mining type. These are customers not subject to price regulation, who freely negotiate prices and conditions of electricity supply with generatiion or distribution companies. In the SEN, for 2020 the customers in this category concentrate 61,3% of the total consumption [9].
In Chile there is no retail market operated through trading companies, however, the Electric Portability Law that seeks to establish this figure is in the first process. . Sales of energy and power to free customers are made directly by the generating companies through bilateral financial contracts or by the distribution companies, which can also be sold to free customers, buying generators. In this sense, the distribution companies have advantages over the generators in their respective areas of concession for the knowledge of the customers and their levels of consumption. However, this can be mitigated if the free customers coordinate and carry out private tenders to add their consumptions and obtain supply contracts with the generating companies. This happened for the first time during 2016 in the region of Biobío where nine companies were grouped and made a bidding, which allowed them to improve the conditions of their contracts.


