2.2. Electricity supply
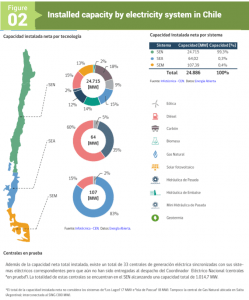
Table 1 summarizes the installed capacity in December 2020 in each of the systems indicated above, disaggregated in conventional sources and non-conventional renewable energy (NCRE). In turn, Figure 2 shows the installed capacities of the systems to December 2020. Updated information on national electricity sector statistics can be found in the website “Energía Abierta”[4].
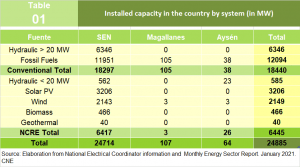
Source: CNE monthly report. January 2021. CNE
The generation offer, expressed both in terms of installed capacity and the contribution of energy in the Chilean electricity sector, is presented in this section and is mainly due to the investments made by private agents and companies. Lately, this offer has been expanding rapidly from NCRE projects. Since 2014, photovoltaic solar technology has considerably increased its installed capacity, mainly due to the great solar resource present in the north of the country, the low costs of this technology, the regulatory changes made to be able to integrate these new resources to the electric system and the management of the tax lands to facilitate its installation 1. On the other hand, investments in wind and solar generation continue to increase considerably in the next years.
The expansion of the national electricity generation plant is presented in Figure 3 in terms of its installed capacity by system. The SEN concentrates 99.3% of the installed capacity and medium-sized systems account for less than 0.7% of the country’s total installed capacity. On average, national installed capacity has increased by 6.64% per year over the last 15 years.
Figure 3: Evolution of installed generation capacity in Chile
Sources: Own elaboration from Statistical Yearbook of Energy. CNE.
During the last 4 years there has been a significant increase in NCRE installed capacity, especially solar and wind power, displacing biomass and mini-hydraulics as the country’s main NCRE sources. It is especially photovoltaic solar technology that has seen the fastest rise, since it has gone from 230 MW installed in 2014 to 3205 MW as of December 2020. Similarly, there are 2,149 MW of wind power installed (see Figure 4). On the other hand, it is expected that 7,557 MW of solar and 3,422 MW of wind will be incorporated in projects under test and declared under construction during 2021.
The dizzying solar development is due in part to the very good conditions of this resource that presents the north of the country, with the highest radiation in the world, availability of tax land for its development, the low cost of this technology in addition to favorable economic and social conditions of the country.
Figure 4: Evolution of installed solar and wind capacity
Source: Own elaboration based on report of Installed Generation Capacity and the Monthly Report NCRE. January 2021. CNE.
Despite the explosive growth of unconventional renewable technologies of the last time, the supply of electric energy in Chile still mainly consists of sources of conventional type (see Figure 5). In general terms, in Chile a plant is called conventional when it uses traditional technologies and that normally correspond to technical and commercially very mature solutions. In the case of Chile, these include coal-fired power plants, combined cycle power plants, diesel engines, gas/oil turbines and, dam and run-of river hydroelectric plants over 20 MW. Considering the thermal power plants (coal, natural gas and diesel oil, totaling 24%) and hydroelectric plants (dam and run-of-river, totaling 54%) conventional generation accounts for about 78% of the national generation. On the other hand, non-conventional renewable energy sources correspond to those that use the following primary energy sources: biomass, hydropower less than 20 MW, geothermal, solar, wind and sea. More details on these technologies and generation statistics are described in section 4.
Figure 5: Electricity generation by type of technology
Source: Own elaboration from Statistical Yearbook of Energy. CNE.