Annex 5: Information Platforms
The Ministry maintains stable measurement campaigns for wind and solar resources in the north of the country. In addition, it has implemented information platforms that allow the indirect evaluation of these resources by means of modeling tools, databases, territorial information and updated cadaster of the resources present in the country. Finally, information resources available for the estimation of water generation, through biomass and using sea energies are also presented in this section.
This program of measurement of renewable resources began in 2006 with the National Energy Commission and then in 2010 with the Ministry of Energy. The objective of the campaign is to have a wind and solar energy survey to better understand the characteristics of these resources.
The results of the measurements have confirmed that the Atacama Desert has one of the largest solar potential in the world, exceeding solar radiation levels of more than 30% in areas of Spain with high presence of generation projects solar. Horizontal global radiation is around 7 kWh / m² per day at most stations, or 2,600 kWh / m2 per year, and normal direct solar radiation (DNI)[42] exceeds 3,000 kWh / m2 per year.
The Ministry of Energy has promoted the application of numerical modeling tools for the atmosphere for purposes of characterizing the potential of NCRE in Chile. These efforts, which continue today, have enabled the development of interactive tools that provide an indirect assessment of the wind and solar resources in most of the country. Among them are the Wind Energy Explorer and the Solar Energy Explorer, which are available and publicly accessible through website of the Ministry[43].
Notwithstanding the usefulness of these tools for the identification and evaluation of potential areas for NCRE projects, their results should be considered only as preliminary and indicative, and they do not replace the on-site monitoring of the meteorological parameters necessary for the feasibility evaluation of this of type of projects.
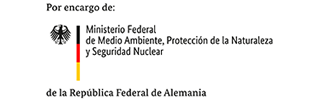
The Wind Energy Explorer presented in Figure 9 summarizes the wind data obtained from atmospheric behavior simulations developed using the Weather Research and Forecasting (WRF) model, which is fed with results from global models. The simulations cover the area between the northern border of the country and the Magallanes Region, including Easter Island. The first version had each with a horizontal spatial resolution of 1 km and 41 vertical levels, of which 12 are within the first 200 meters above ground level, useful range for the evaluation of wind power projects. The latter has a variable spacing between 5 and 34 meters above the level of the earth’s surface. The new version adds representative WRF data from the year 2015 of 1km spatial resolution that are distributed in only 5 spatial domains that span from Arica to Cabo de Hornos. In addition, it has a weather reconstruction technique that has been improved that allows obtaining better and more extensive results at the hourly level (period 1980-2017). Additionally, it has tools that allow to analyze data collected from meteorological stations.
The Wind Explorer is organized into 3 modules: the exploration of the wind resource module aimed at analyzing the behavior of the modeled wind at a site of interest, the calculation module of the wind turbine aimed at estimating the generation performance of a wind turbine, and the resource measurement module. wind energy for the analysis of variables measured from wind prospecting stations of initiatives related to the Ministry of Energy.
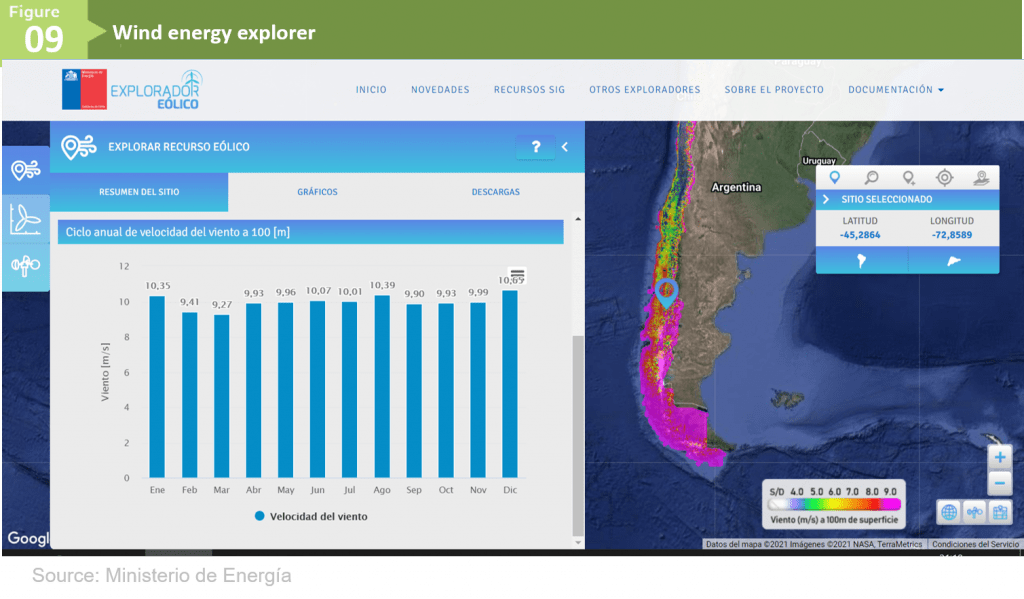
On the other hand, the Solar Energy Explorer presented in Figure 11 summarizes the results of the estimation of solar radiation in most of Chile, obtained from a methodology that uses information from satellites that regularly cover the country combined with the modeling of the processes in which the solar radiation is modified as it passes through the atmosphere. To do this, solar radiation is calculated on the surface with clear sky from a radiative transfer model, to be adjusted later by interaction with the different types of clouds, whose characteristics are estimated from images of the geostationary satellite GOES West, through an empirical model based on the network of local observations of surface radiation.
Along with other information, the Solar Energy Explorer offers maps of the monthly average of horizontal global radiation. The data are generated from atmospheric models and satellite data for the period between 2004 and 2015, with a spatial resolution of 90 meters. The tool allows to generate reports on selected sites that include the characterization of the daily and seasonal cycles of global horizontal radiation and observed cloudiness and of course obtain the data series in plain text files.
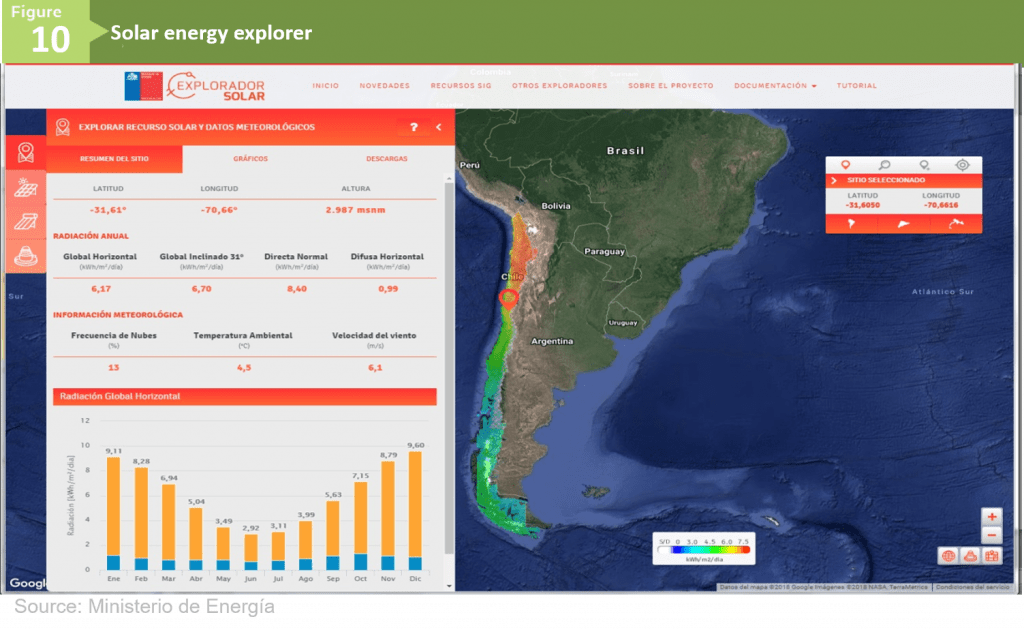
The Ministry of Energy from 2014, and in compliance with the commitments made in the Energy Agenda, has implemented the Exploration of Non-Consumption Water Use Rights (DAANC), with the purpose of maintaining and operating an information platform updated and georeferenced information on the rights of use of non-consumptive waters granted for use in hydroelectricity in the SEN priority basins.
This public information tool allows identifying and characterizing zones in the early stages and prospective for hydroelectric initiatives, along with the spatial visualization of water rights, holders of water rights, historical information, hydroelectric capacity installed in electric systems, among others . This platform is available on the website of the Ministry[44].
One of the most important applications of this platform is the annual update of the hydroelectric potential at the country level, whose methodology is based on the information provided by non-consumptive rights constituted, as they represent the volume of water that is legally available for hydroelectric development. The calculation methodology is explained in detail on the application web page.
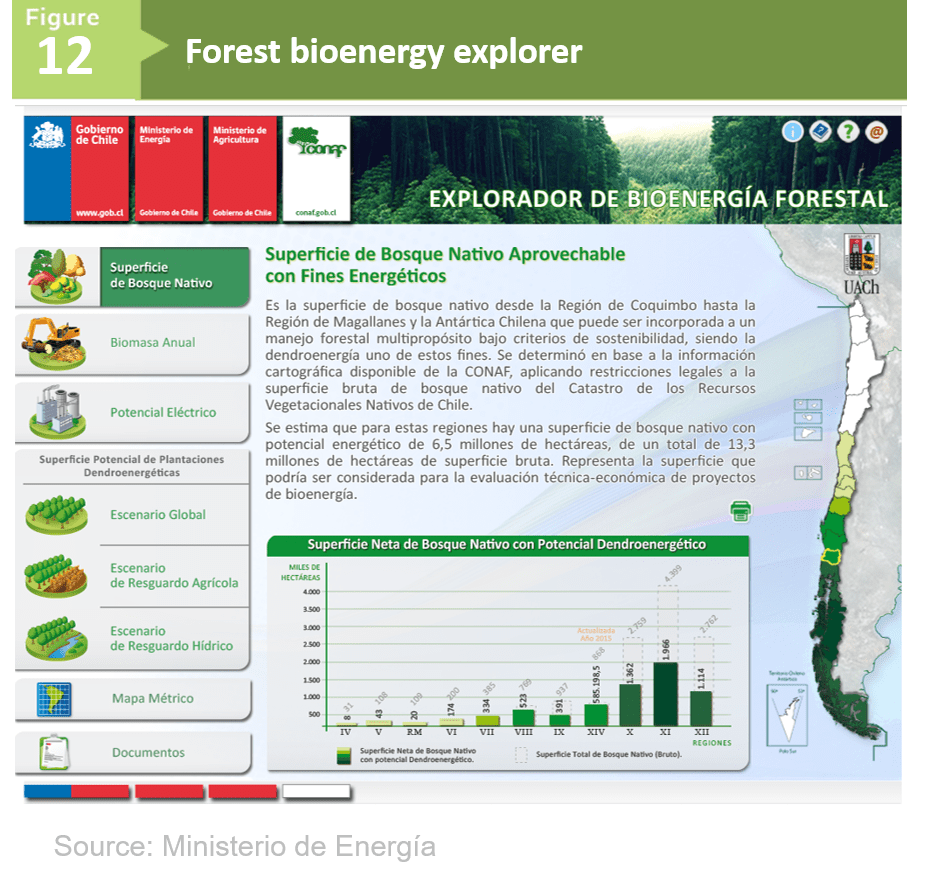
The CONAF Territorial Information System (See Figure 14) allows you to consult on-line information on vegetation cadaster updates. In this way, this tool presents the most complete national map of reference information on the potential of forest biomass in Chile. Through this tool you can review interactive maps for each region, analyze different layers (roads, hydrography, water bodies, wilderness areas, agricultural land, meadows and shrublands, native forest, wetlands, non-vegetation areas and a categorization layer of land use), perform operations such as measuring distances, areas and download cartographic covers. The tool also allows access to a catalog of satellite images that can provide additional information to maps already generated in the system.
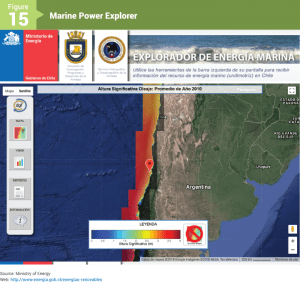
The marine exploration is a tool that allows to visualize and obtain information on Chile’s marine energy resource. This information is generated from numerical simulations covering the maritime territory from Arica to the extreme south of the country. The simulations were performed using the Wave Watch III model (WWIII) and SWAN (Simulating Waves Nearshore), the latter in high spatial resolution (100 meters). The height, direction and wave period for a full year (2010) were simulated and the results validated with observations throughout the country.
The tool allows to generate a report for each location designated by the user who presents the basic wave statistic for each month (significant height corresponding to the average height of the third of the highest waves in a set of waves, the average period which corresponds to the average time interval between two waves, the energy power per square meter and the average propagation direction). It also presents the frequency distribution of significant wave height, the time series plot of significant height and power for each month, the interannual variability of height and power and the direction rose of wave propagation for the full year. Finally the tool allows to download the complete numerical series of the data in format of plain text to carry out own analyzes.
The Heating Explorer is a tool that seeks to guide consumers regarding the different alternatives that exist, in consideration of the geographic variability associated with heating consumption, the most common heating alternatives that exist, the level of comfort they provide. , and the comprehensive costs of implementing them beyond the initial investment, in consideration of the associated operating costs.
The methodology used corresponds to a simplified energy model based on previous simulation results, which integrates multiple databases of yields, prices and meteorological variables, and also evaluates the comfort that the consumer obtains with their existing solution.